

How are we doing?
Understanding how your entity is performing compared to other entities is key to improving performance. Since 2018, the Virginia Risk Sharing Association’s (VRSA) website has featured four member peer analysis dashboards. These dashboards allow members to compare their claims experience to similar VRSA member entities on workers’ compensation, auto liability and law enforcement liability lines of business.
These dashboards have been updated to enrich the data points used to establish member peer groups.
The updated dashboards may be accessed by scrolling to the bottom of the ‘Dashboards’ widget in the ‘At a Glance’ section of your VRSA website home page, or by navigating to the Dashboards page under the Claims section of the top menu bar. If you do not have access to these areas of the website, you may contact: internet@vrsa.us for assistance.
The following information and screenshots provide an overview of these new dashboards.
Peer Groups
Peer groups are created based on member characteristics.
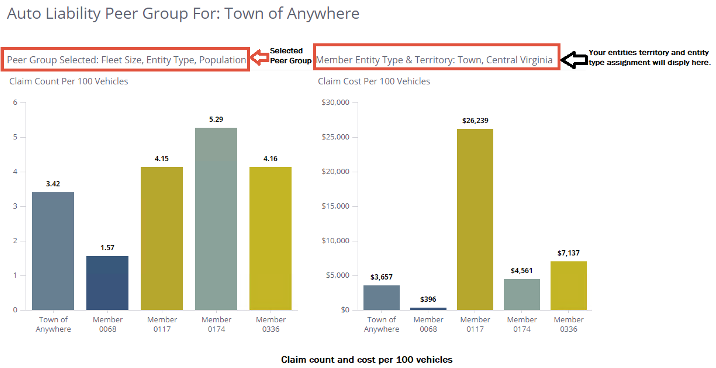
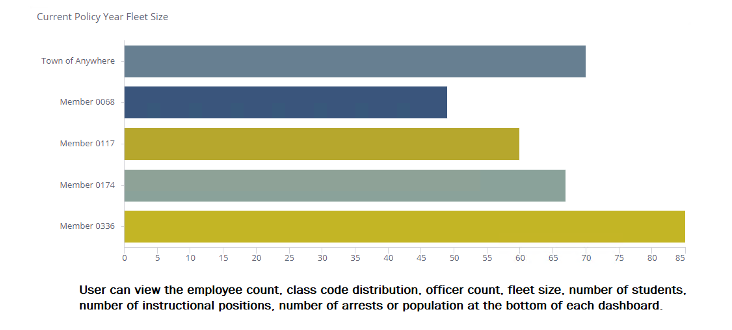
Historically, these characteristics included total number of employees, class code payroll composition, vehicle fleet size (excluding trailers), entity territory, and entity type.
Through the use of publicly available data sources, we have been able to add the following characteristics: number of arrests (source: Virginia State Police), number of students (Source: Virginia Department of Education), number of instructional positions (Source: Virginia Department of Education), and population (Source: United States Census Bureau).
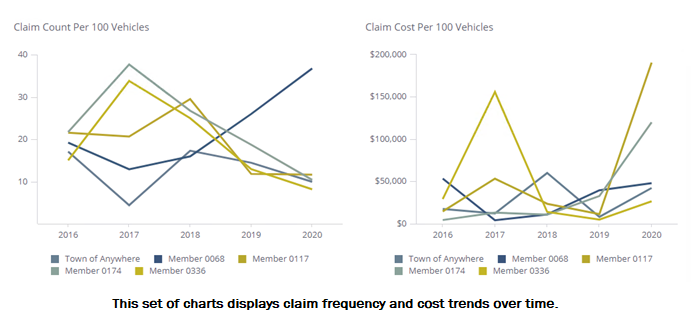
Characteristics are then combined to create various peer groups by line of business. The four members (where possible) with the most similar characteristics will be displayed alongside your own entity. Peers are assigned an alias to provide confidentiality.
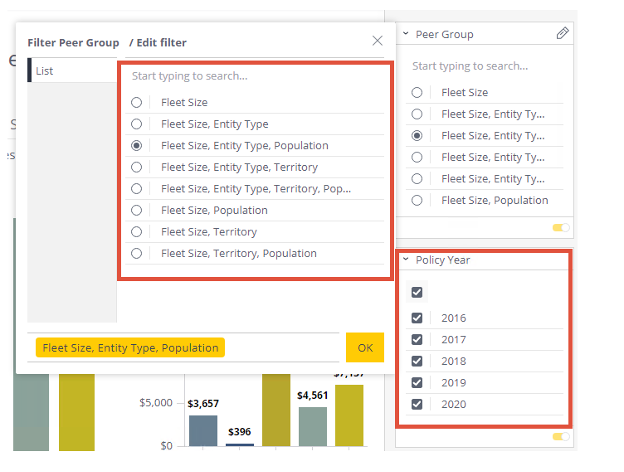
Filters
Members can filter results and toggle between combinations of characteristics to change or refine peer groups.
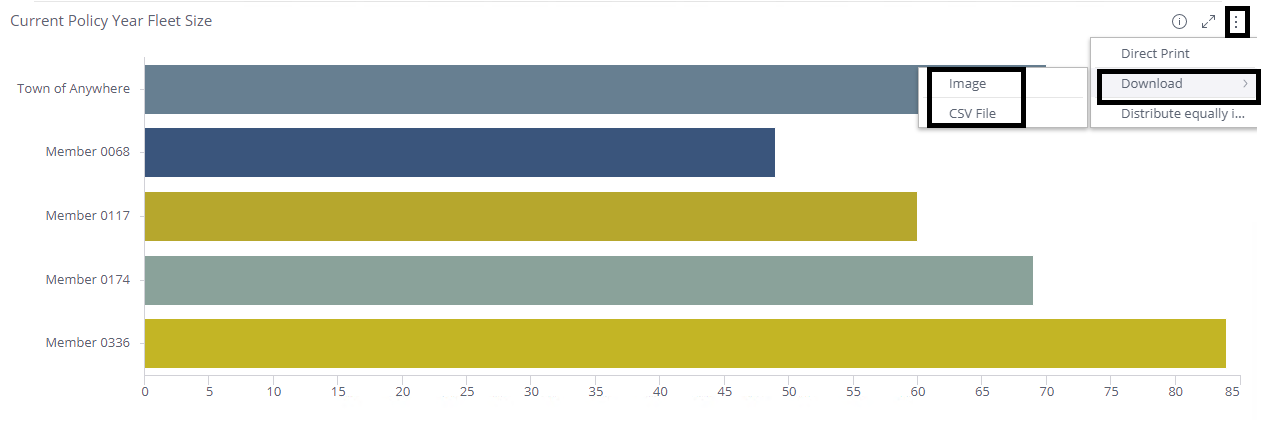
Exporting Results
As is the case in all VRSA member dashboards, individual visualizations can be exported via the export button.
Want to learn more?
VRSA will be hosting an overview webinar on this topic on Wednesday, June 2. Register here.